The Essentials of Sound Quality: IMHO
by
Published on 03-31-2015 05:31 AM
Number of Views: 27654
Basics of Drivers:
The following sections are intended to help you understand the important aspects of a raw driver and data which will then lead to helping determine nominal crossover points.
Response Types:
Frequency Response:
- The measure of frequency (Hz) vs amplitude (dB) across a given range
- Multiple frequency response measurements at varying axes are taken to show how the driver behaves in all directions. Those axes are comprised of the following:
- On-axis response: Speaker/system response when the listener is directly facing the speaker (SINGLE POINT).
- Off-axis response: Speaker/system response when the listener is anywhere EXCEPT directly on-axis (typical range is 15 to 90 degrees off-axis in car).
- Ideally, the frequency response will indicate no hot or cold spots in response as the listener/measurement mic moves around the speaker
- The driver or speaker shall maintain its general response, other than a decreasing output level as the frequency gets higher
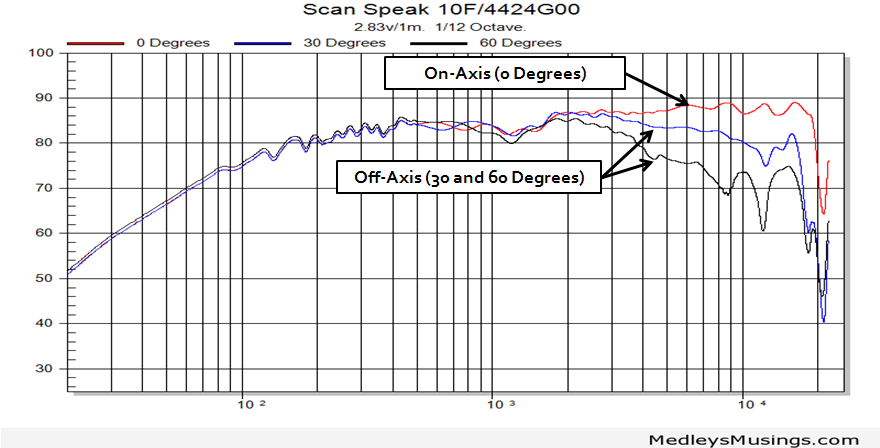
Below is the frequency response on-axis (0 degrees) and off-axis (30 and 60 degrees). Note the graph legend in addition to callouts.
Polar Response:
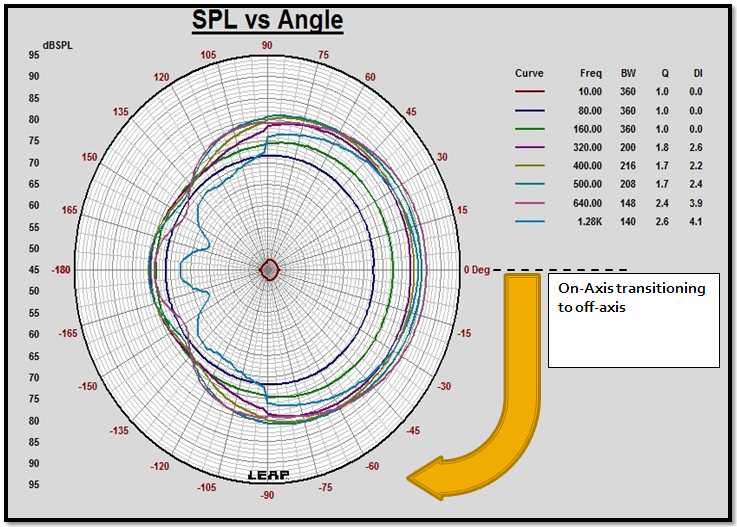
- Another way of relating frequency response using a particular frequency or frequencies, mapped out in a polar pattern, representing the directivity of a speaker at varying angles (ie; as you move from 0 degrees on-axis to any angle off-axis)
Below is a polar response example of a speaker modeled in LEAP. The model was derived based on a simulated horizontal axis measurement ranging from 10hz to 1.28khz. You can see that as the frequency increases, the radiation changes from omnidirectional to more directional.
Power Response:
- Single measurement which is the sum total of both direct and reflected sounds and is a representative example of what the listener will hear at a given location
- Typically an average of multiple measurements in the listeners head area
- An ideal power response is one with no significant peaks or dips caused by irregularities from any single axis of measure
- The total response shall roll-off smoothly. The rate of roll-off is a matter of directivity index.
- When you RTA and average the results, power response is what you are measuring.
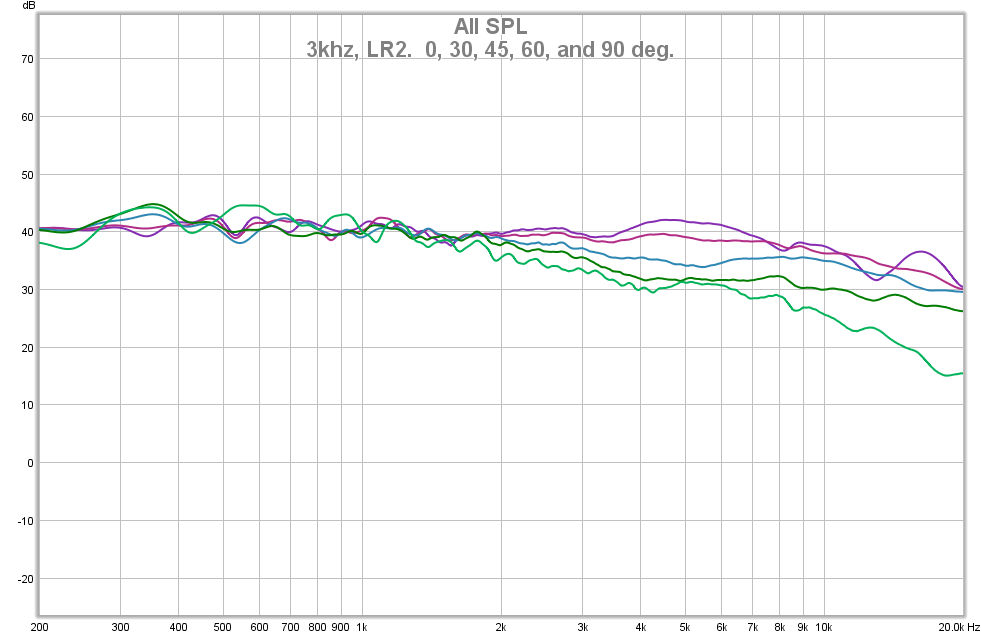
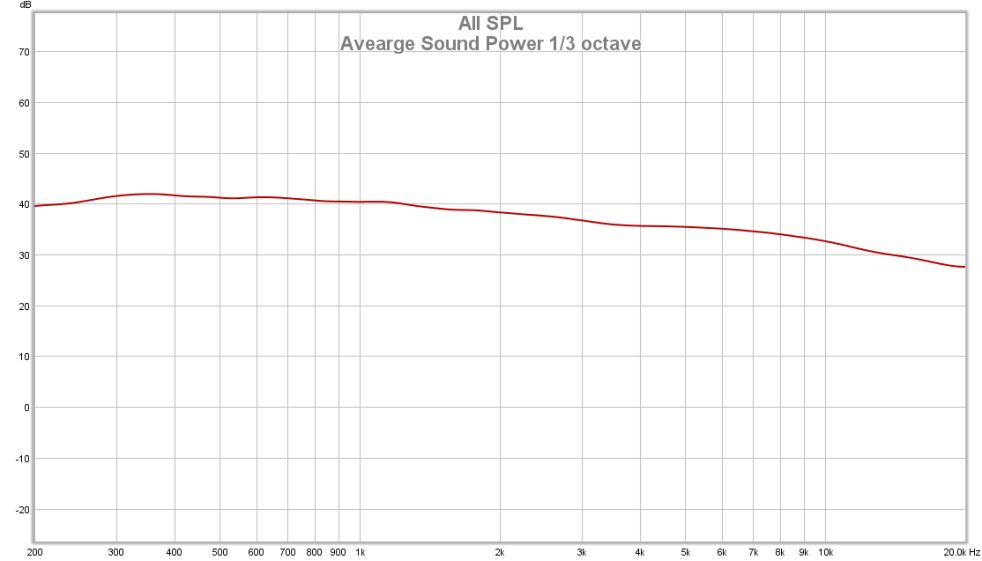
The picture below shows a speaker measured both on and off-axis in varying axes. The subsequent picture is an average of all these measurements, which results in the power response measurement.


 Menu
Menu


 Recent Posts
